MIT6828-Lab1-启动一个PC

HumanCore - CP/M-17 Version 1.0, Date: January 08, 1996

实验准备

首先,建议使用32位ubuntu虚拟机作为实验环境,不建议自己配置,因为会遇到各种坑。我们的主要目的是学习操作系统,不是安装各种环境及工具,下载一个32位的ubuntu桌面镜像,然后配置一个虚拟机即可。我这里使用的是16.04版本的32位ubuntu镜像,使用的虚拟机是vmware。需要的qemu等软件可以在如下网站中进行下载,此处wo’shi’yong

软件安装

编译工具链

输入如下命令

1
% objdump -i

The second line should say elf32-i386.

1
% gcc -m32 -print-libgcc-file-name

The command should print something like /usr/lib/gcc/i486-linux-gnu/*version*/libgcc.a or /usr/lib/gcc/x86_64-linux-gnu/*version*/32/libgcc.a

If both these commands succeed, you’re all set, and don’t need to compile your own toolchain.

If the gcc command fails, you may need to install a development environment. On Ubuntu Linux, try this:

1
% sudo apt-get install -y build-essential gdb

On 64-bit machines, you may need to install a 32-bit support library. The symptom is that linking fails with error messages like “__udivdi3 not found” and “__muldi3 not found”. On Ubuntu Linux, try this to fix the problem:

1
% sudo apt-get install gcc-multilib

git

请使用git获取实验源文件

1
2
3
4
5
6
athena% mkdir ~/6.828
athena% cd ~/6.828
athena% add git
athena% git clone https://pdos.csail.mit.edu/6.828/2018/jos.git lab
Cloning into lab...
athena% cd lab

使用git diff origin/lab1对于代码的改变进行跟踪

qemu

本实验使用qemu作为虚拟机,因此需要安装qemu,archlinux下安装qemu的方法很简单,需要注意的是,安装完成后,需要编辑lab/conf/env.mk文件,将

1
# QEMU

改为

1
QEMU=/usr/bin/qemu-system-i386

这样就为QEMU设置了路径。如果没有qemu-system-i386,请到这个网站下载。这里必须使用i386,否则会出现gdb和qemu体系结构不匹配的问题。

作业上传

接下来去这个网页,用自己的邮箱注册一个账号,这样就可以上传作业并进行批改。以后只需要在lab文件中执行make handin,即可提交作业,下面的XXXXXXXXXXXXXXXXXXXXXXXXXXXXXXXX改为自己邮箱注册后的API

1
2
3
4
5
6
7
8
athena% make handin
git archive --prefix=lab1/ --format=tar HEAD | gzip > lab1-handin.tar.gz
Get an API key for yourself by visiting https://6828.scripts.mit.edu/2018/handin.py/
Please enter your API key: XXXXXXXXXXXXXXXXXXXXXXXXXXXXXXXX
% Total % Received % Xferd Average Speed Time Time Time Current
Dload Upload Total Spent Left Speed
100 50199 100 241 100 49958 414 85824 --:--:-- --:--:-- --:--:-- 85986
athena%

作业批改

运行下面的命令进行作业批改

1
make grade

需要注意的是,要将./grade-lab1的权限修改为可运行,此外,如果是linux系统,可能会出现下面的错误:

1
/usr/bin/env: "python\r": 没有那个文件或目录

这个是因为UNIX和Linux上的字符集的差异所造成的,解决方法是vim grade-lab1,然后输入:set ff=unix,再保存即可。

第一部分 PC Bootstrap

x86汇编

这里请参考应用于NASM 编译器的汇编教程Intel/AT&T汇编语法转换。本实验所用的汇编语言是AT&T 语法

x86模拟

我们使用qemu虚拟器对我们所编写的操作系统进行模拟,进入lab后,运行make,对操作系统进行编译:

1
2
3
4
5
6
7
8
9
10
11
12
13
14
15
16
17
18
$ make
+ as kern/entry.S
+ cc kern/entrypgdir.c
+ cc kern/init.c
+ cc kern/console.c
+ cc kern/monitor.c
+ cc kern/printf.c
+ cc kern/kdebug.c
+ cc lib/printfmt.c
+ cc lib/readline.c
+ cc lib/string.c
+ ld obj/kern/kernel
ld: warning: section `.bss' type changed to PROGBITS
+ as boot/boot.S
+ cc -Os boot/main.c
+ ld boot/boot
boot block is 396 bytes (max 510)
+ mk obj/kern/kernel.img

然后我们就获得了一个镜像文件kernel.img,运行make qemu即可在qemu虚拟机下,运行我们的操作系统,运行成功的结果如下:

1
2
3
4
5
6
7
8
9
10
11
12
13
14
15
16
17
Booting from Hard Disk...
6828 decimal is XXX octal!
entering test_backtrace 5
entering test_backtrace 4
entering test_backtrace 3
entering test_backtrace 2
entering test_backtrace 1
entering test_backtrace 0
leaving test_backtrace 0
leaving test_backtrace 1
leaving test_backtrace 2
leaving test_backtrace 3
leaving test_backtrace 4
leaving test_backtrace 5
Welcome to the JOS kernel monitor!
Type 'help' for a list of commands.
K>

目前这个操作系统提供了两个命令:

1
2
3
4
5
6
7
8
9
10
11
K> help
help - display this list of commands
kerninfo - display information about the kernel
K> kerninfo
Special kernel symbols:
entry f010000c (virt) 0010000c (phys)
etext f0101a75 (virt) 00101a75 (phys)
edata f0112300 (virt) 00112300 (phys)
end f0112960 (virt) 00112960 (phys)
Kernel executable memory footprint: 75KB
K>

机器的物理地址空间

一个计算机(32位)的物理地址空间布局基本如下:

1
2
3
4
5
6
7
8
9
10
11
12
13
14
15
16
17
18
19
20
21
22
23
24
25
26
27
28
29
30

+------------------+ <- 0xFFFFFFFF (4GB)
| 32-bit |
| memory mapped |
| devices |
| |
/\/\/\/\/\/\/\/\/\/\

/\/\/\/\/\/\/\/\/\/\
| |
| Unused |
| |
+------------------+ <- depends on amount of RAM
| |
| |
| Extended Memory |
| |
| |
+------------------+ <- 0x00100000 (1MB)
| BIOS ROM |
+------------------+ <- 0x000F0000 (960KB)
| 16-bit devices, |
| expansion ROMs |
+------------------+ <- 0x000C0000 (768KB)
| VGA Display |
+------------------+ <- 0x000A0000 (640KB)
| |
| Low Memory |
| |
+------------------+ <- 0x00000000

早期的计算机内存很小,可能只有64KB的RAM。从0x000A000到0x000FFFFF这一段被用于硬件用途,例如视频播放缓存等。最重要的是BIOS所在的内存,占据了0x000F0000到0x000FFFFF的64KB空间。早期的BIOS是写死的,现在的计算机BIOS都位于可刷新的闪存区域。关于BIOS的讲解详见。

BIOS

启动过程调试

至此,我们终于可以使用qemu启动我们的程序,并观察启动的过程。在lab文件夹下,执行

1
make qemu-gdb

即可令qemu运行在调试模式下,此时qemu作为一个虚拟远程机进入调试模式,打开另一个终端,输入make gdb,即可看到下面的内容

1
2
3
4
5
6
7
8
9
10
Type "apropos word" to search for commands related to "word".
+ target remote localhost:26000
warning: No executable has been specified and target does not support
determining executable automatically. Try using the "file" command.
The target architecture is set to "i8086".
[f000:fff0] 0xffff0: ljmp $0x3630,$0xf000e05b
0x0000fff0 in ?? ()
+ symbol-file obj/kern/kernel
warning: A handler for the OS ABI "GNU/Linux" is not built into this configuration
of GDB. Attempting to continue with the default i8086 settings.

这里又遇到了一个坑,gdb反汇编的结果是有问题的,按照16位汇编的结果,应当CS=0xf000,而IP=0xe05b,但是这里gdb是用32位的模式进行的反汇编,结果就是CS=0x3630,而IP=$0xf000e05b,这不是我们想要的,解决方法如下:

  • 在lab文件夹下执行如下命令:
1
2
$ echo '<?xml version="1.0"?><!DOCTYPE target SYSTEM "gdb-target.dtd"><target><architecture>i8086</architecture><xi:include href="i386-32bit.xml"/></target>' > target.xml
$ wget https://raw.githubusercontent.com/qemu/qemu/master/gdb-xml/i386-32bit.xml
  • 然后修改gdbinit.tmpl文件,将
1
2
3
12     if $lastcs == -1 || $lastcs == 8 || $lastcs == 27                           
13 set architecture i8086
14 end

修改为

1
2
3
4
12     if $lastcs == -1 || $lastcs == 8 || $lastcs == 27                           
13 set architecture i8086
14 set tdesc filename target.xml
15 end
  • 重新make
1
2
$ make clean
$ make

add-auto-load-safe-path /home/duan/Code/linux/6.828/xv6-public/.gdbinit添加至/home/user/.gdbinit文件夹下(如果没有就新建一个),再次执行make gdb,我们得到了下面的结果:

1
2
3
[f000:fff0]    0xffff0:	ljmp   $0xf000,$0xe05b
0x0000fff0 in ?? ()
+ symbol-file obj/kern/kernel

这次的结果就很完美,是我们想要的,解释一下几个参数

  • 系统开始执行的物理地址为[CS:IP]=[f000:fff0],这个区域位于内存的BIOS区域上部,实际物理地址为16*CS+IP=0xffff0(实模式寻址)
  • 第一条指令为一个ljmp指令,跳转至CS=0xf000, IP=0xe05b

这样启动后系统进入了BIOS区,可以确保上电后由BIOS接管机器,此时CPU处在实模式(所谓实模式,就是其地址采用真实的物理地址)。0xffff0是BIOS末尾(0x100000)的前16位,所以机器一上电,位于0xffff0,然后赶紧往回跳转,跳到0xfe05b,毕竟16byte什么都做不了。这一段代码是qemu内置的BIOS启动代码,和课程的代码无关,只需要了解他执行了一些上电检查,然后就将控制权交给了Boot loader段。我们只需要知道我们写的boot loader段起始位置在0x7c00即可(关于0x7c00这个魔数请参考9)。

练习:使用gdb si多运行几行命令,猜测命令的作用

在这里我一共运行了五次si,分别记录下了命令和相应的结果

第一次si

第一次si得到的命令为

1
[f000:xe05b]    0xfe05b: cmpl   $0x0, %cs:0x6308  # 此条命令占据7byte

这是一个长比较命令,对立即数0x0和f000:6308这个地址上的数进行了比较,推测是0x6308上有一些设置需要进行判断。但是具体是什么并不清楚。

第二次si

第二次si得到的命令为

1
[f000:e062]    0xfe062: jne    0xfd0a2  # 此条命令占据4byte

如果不相等,就跳转至0xfd0a2,结合第一次si的结果可知,如果cs:0x6308保存的值不为0,那么跳转至0xfd0a2。

第三次si

第三次si得到的命令为

1
[f000:e066]    0xfe066: xor    %dx, %dx  # 此条命令占据2byte

根据命令的地址,我们知道cs:0x6308保存的值确实为1,命令顺序执行,这里进行一个异或操作,清空dx寄存器。

第四次si

第四次si得到的命令为

1
[f000:e068]    0xfe068: mov    %dx, %ss

将dx寄存器中的值保存至ss寄存器。就是说堆栈段基地址为0x0000

第五次si

第五次si得到的命令为

1
[f000:e06a]    0xfe06a: mov    0x7000, %esp

将0x7000保存至esp寄存器,说明堆栈段的地址为0x07000。可以看到,操作系统一开始的工作是进行了一些对内存的分段的操作。

Boot Loader

BIOS完成后,我们要进行Boot Loader,Boot Loader代码位于硬盘上,而硬盘扇区大小为512字节(现在也有4K的,能够加载更大的boot loader),Boot Loader程序就位于硬盘最初的512B上,我们要将整个扇区加载到内存物理地址为0x7c00到0x7dff所在的位置,然后使用jmp命令跳转至CS:IP = [0000:7c00],将控制权移交给Boot Loader。boot loader的程序为boot/boot.Sboot/main.c,本节的主要工作就是阅读并理解这两个程序。boot loader主要完成两个功能:

  • 一:从实模式切换至32位保护模式,这样软件才能访问处理器的全部物理地址空间,关于保护模式请参考1.2.7和1.2.8节
  • 二:boot loader通过x86的特殊io机制,直接访问硬盘设备的寄存器,读取硬盘上的内核

下面给出boot/boot.Sboot/main.c的算法,其中,关于A20的控制请参考6

点击显/隐boot.S代码
1
2
3
4
5
6
7
8
9
10
11
12
13
14
15
16
17
18
19
20
21
22
23
24
25
26
27
28
29
30
31
32
33
34
35
36
37
38
39
40
41
42
43
44
45
46
47
48
49
50
51
52
53
54
55
56
57
58
59
60
61
62
63
64
65
66
67
68
69
70
71
72
73
74
75
76
77
78
79
80
81
82
83
84
85
86
87
88
89
90
91
92
#include <inc/mmu.h>

# Start the CPU: switch to 32-bit protected mode, jump into C.
# The BIOS loads this code from the first sector of the hard disk into
# memory at physical address 0x7c00 and starts executing in real mode
# with %cs=0 %ip=7c00.
# 这段代码将被加载至0x7c00处,然后以实模式运行

.set PROT_MODE_CSEG, 0x8 # kernel code segment selector
.set PROT_MODE_DSEG, 0x10 # kernel data segment selector
.set CR0_PE_ON, 0x1 # protected mode enable flag

.globl start
start:
.code16 # Assemble for 16-bit mode
cli # Disable interrupts BIOS作为一个微型操作系统,也是会开启中断的,但是BIOS结束后
# 再触发硬件中断就不安全了,所以要先关闭中断
cld # String operations increment

# Set up the important data segment registers (DS, ES, SS).
# BIOS并不保证这些寄存器中的值,所以要先清空
xorw %ax,%ax # Segment number zero
movw %ax,%ds # -> Data Segment
movw %ax,%es # -> Extra Segment
movw %ax,%ss # -> Stack Segment

# Enable A20:
# For backwards compatibility with the earliest PCs, physical
# address line 20 is tied low, so that addresses higher than
# 1MB wrap around to zero by default. This code undoes this.
# 关于这一部分的解释详见附录6,看不懂可以先略过,总之就是为了前向兼容
# 实际运行中,这两段也就是跳过了
seta20.1:
inb $0x64,%al # Wait for not busy |al|<--------|0x64|
testb $0x2,%al # 0x00000010和al寄存器按位与,如果结果为0,将ZF置1
jnz seta20.1 # 如果ZF为1,跳转

movb $0xd1,%al # 0xd1 -> port 0x64
outb %al,$0x64

seta20.2:
inb $0x64,%al # Wait for not busy
testb $0x2,%al
jnz seta20.2

movb $0xdf,%al # 0xdf -> port 0x60
outb %al,$0x60
# 从实模式向保护模式切换
# Switch from real to protected mode, using a bootstrap GDT
# and segment translation that makes virtual addresses
# identical to their physical addresses, so that the
# effective memory map does not change during the switch.
# Global Descriptor Table (GDT) is a table in memory that defines the processor's memory segments.
lgdt gdtdesc #将gdtdesc标识符送入全局描述符表GDTR寄存器中,这个标识符在文件末尾,给GDTR新值
movl %cr0, %eax #
orl $CR0_PE_ON, %eax #将cr0寄存器第0位置1,进入保护模式
movl %eax, %cr0

# 此时已经进入保护模式,但是CS还未更新,所以需要用ljmp进行更新,更新后CS为0x8
# Jump to next instruction, but in 32-bit code segment.
# Switches processor into 32-bit mode.
# ljmp完成了从16到32位的切换,由于不能直接设置CS,所以我们使用ljmp更改
ljmp $PROT_MODE_CSEG, $protcseg # 0000 0000 0000 1 000 selector为0000 0000 0000 1,使用GDT,优先级为00

.code32 # Assemble for 32-bit mode
protcseg:
# Set up the protected-mode data segment registers
movw $PROT_MODE_DSEG, %ax # Our data segment selector
movw %ax, %ds # -> DS: Data Segment
movw %ax, %es # -> ES: Extra Segment
movw %ax, %fs # -> FS
movw %ax, %gs # -> GS
movw %ax, %ss # -> SS: Stack Segment

# Set up the stack pointer and call into C.
movl $start, %esp
call bootmain # 0x7d19

# If bootmain returns (it shouldn't), loop.
spin:
jmp spin

# Bootstrap GDT
.p2align 2 # force 4 byte alignment
gdt:
SEG_NULL # null seg
SEG(STA_X|STA_R, 0x0, 0xffffffff) # code seg
SEG(STA_W, 0x0, 0xffffffff) # data seg

gdtdesc:
.word 0x17 # sizeof(gdt) - 1
.long gdt # address gdt
点击显/隐boot/main.c代码
1
2
3
4
5
6
7
8
9
10
11
12
13
14
15
16
17
18
19
20
21
22
23
24
25
26
27
28
29
30
31
32
33
34
35
36
37
38
39
40
41
42
43
44
45
46
47
48
49
50
51
52
53
54
55
56
57
58
59
60
61
62
63
64
65
66
67
68
69
70
71
72
73
74
75
76
77
78
79
80
81
82
83
84
85
86
87
88
89
90
91
92
93
94
95
96
97
98
99
100
101
102
103
104
105
106
107
108
109
110
111
112
113
114
115
116
117
118
119
120
121
122
123
124
125
126
127
128
129
130
131
132
133
134
135
136
//根据 boot/Makefrag, main.o被加载到
#include <inc/x86.h>
#include <inc/elf.h>

/**********************************************************************
* This a dirt simple boot loader, whose sole job is to boot
* an ELF kernel image from the first IDE hard disk.
*
* DISK LAYOUT
* * This program(boot.S and main.c) is the bootloader. It should
* be stored in the first sector of the disk.
*
* * The 2nd sector onward holds the kernel image.
*
* * The kernel image must be in ELF format.
*
* BOOT UP STEPS BIOS加载BOOTLOADER
* * when the CPU boots it loads the BIOS into memory and executes it
*
* * the BIOS intializes devices, sets of the interrupt routines, and
* reads the first sector of the boot device(e.g., hard-drive)
* into memory and jumps to it.
*
* * Assuming this boot loader is stored in the first sector of the
* hard-drive, this code takes over...
*
* * control starts in boot.S -- which sets up protected mode,
* and a stack so C code then run, then calls bootmain()
*
* * bootmain() in this file takes over, reads in the kernel and jumps to it.
**********************************************************************/

#define SECTSIZE 512 // 扇区大小为512
#define ELFHDR ((struct Elf *) 0x10000) // scratch space

void readsect(void*, uint32_t); // 读取一个Sector
void readseg(uint32_t, uint32_t, uint32_t); // 读取一个程序段

void
bootmain(void)
{
struct Proghdr *ph, *eph;

// read 1st page off disk
readseg((uint32_t) ELFHDR, SECTSIZE*8, 0); //将主引导扇区加载至0x10000内存处,这个扇区是ELF格式,能够对后续的内核进行加载
//这个函数调用过程如下:
// push $0x0
// push $0x1000
// push $0x10000 分别压入三个参数

// is this a valid ELF?
if (ELFHDR->e_magic != ELF_MAGIC)
goto bad;

// load each program segment (ignores ph flags)
// 找到第一个程序头表项的起始地址和结束地址
ph = (struct Proghdr *) ((uint8_t *) ELFHDR + ELFHDR->e_phoff);
eph = ph + ELFHDR->e_phnum;
// 读取内核,内核的大小就是从ph到eph
for (; ph < eph; ph++)
// p_pa is the load address of this segment (as well
// as the physical address)
readseg(ph->p_pa, ph->p_memsz, ph->p_offset);

// call the entry point from the ELF header 执行内核
// note: does not return!
((void (*)(void)) (ELFHDR->e_entry))(); //call *0x10018

// 故障!
bad: //7d77 <bootmain+0x5e>
outw(0x8A00, 0x8A00);
outw(0x8A00, 0x8E00);
while (1)
/* do nothing */;
}

// Read 'count' bytes at 'offset' from kernel into physical address 'pa'.
// Might copy more than asked
// 从offset 读取count字节到pa
void
readseg(uint32_t pa, uint32_t count, uint32_t offset)
{
uint32_t end_pa;

end_pa = pa + count;

// round down to sector boundary
pa &= ~(SECTSIZE - 1);

// translate from bytes to sectors, and kernel starts at sector 1
offset = (offset / SECTSIZE) + 1;

// If this is too slow, we could read lots of sectors at a time.
// We'd write more to memory than asked, but it doesn't matter --
// we load in increasing order.
while (pa < end_pa) {
// Since we haven't enabled paging yet and we're using
// an identity segment mapping (see boot.S), we can
// use physical addresses directly. This won't be the
// case once JOS enables the MMU.
readsect((uint8_t*) pa, offset);
pa += SECTSIZE;
offset++;
}
}

// 下面是readsect 的具体实现,可以先不看
void
waitdisk(void)
{
// wait for disk reaady
while ((inb(0x1F7) & 0xC0) != 0x40)
/* do nothing */;
}

void
readsect(void *dst, uint32_t offset)
{
// wait for disk to be ready
waitdisk();

outb(0x1F2, 1); // count = 1

outb(0x1F3, offset);
outb(0x1F4, offset >> 8);
outb(0x1F5, offset >> 16);
outb(0x1F6, (offset >> 24) | 0xE0);

outb(0x1F7, 0x20); // cmd 0x20 - read sectors

// wait for disk to be ready
waitdisk();

// read a sector
insl(0x1F0, dst, SECTSIZE/4);
}

练习:使用gdb从boot loader开始调试

跳转至boot loader开始位置

在0x7c00处设置断点,然后执行,停止在0x7c00处

1
2
3
4
5
6
7
(gdb) br *0x7c00
Breakpoint 1 at 0x7c00
(gdb) c
Continuing.
[ 0:7c00] => 0x7c00: cli

Breakpoint 1, 0x00007c00 in ?? ()

停留的位置即为boot.S开始处,使用x/N addr进行反汇编,查看此处的代码,反汇编结果如下:

1
2
3
4
5
6
7
8
9
10
11
(gdb) x/10 0x7c00
=> 0x7c00: cli
0x7c01: cld
0x7c02: xor %ax,%ax
0x7c04: mov %ax,%ds
0x7c06: mov %ax,%es
0x7c08: mov %ax,%ss
0x7c0a: in $0x64,%al
0x7c0c: test $0x2,%al
0x7c0e: jne 0x7c0a
0x7c10: mov $0xd1,%al

可以看到确实是在boot.S开始位置。

研究readsect,弄清楚每一句语句的作用
1
2
3
4
5
6
7
8
9
10
11
12
13
14
15
16
17
18
19
20
21
22
23
24
25
26
27
28
29
30
31
32
33
34
35
36
37
// 下面是readsect 的具体实现,可以先不看
void
waitdisk(void)
{
// wait for disk reaady 11000000 01000000
while ((inb(0x1F7) & 0xC0) != 0x40) //读0x1F7,这个端口可以表示硬盘状态,判断最高位是否为1,是1硬盘未就绪
/* do nothing */;
}

void
readsect(void *dst, uint32_t offset) //从第offset个扇区开始读取
{
// wait for disk to be ready
waitdisk();

// 0x1F2-0x1F7 The primary ATA harddisk controller.
outb(0x1F2, 1); // count = 1 设置读取扇区的数目为1

outb(0x1F3, offset);
outb(0x1F4, offset >> 8);
outb(0x1F5, offset >> 16);
outb(0x1F6, (offset >> 24) | 0xE0); // 1110 0000
// 上面四条指令联合制定了扇区号
// 在这4个字节线联合构成的32位参数中
// 29-31位强制设为1
// 28位(=0)表示访问"Disk 0"
// 0-27位是28位的偏移量
// 所以上面的语句是找到Disk 0,偏移量位28位的

outb(0x1F7, 0x20); // cmd 0x20 - read sectors

// wait for disk to be ready
waitdisk();

// read a sector
insl(0x1F0, dst, SECTSIZE/4); // 从0x1F0读取SECTSIZE字节数到dst的位置,每次读四个Byte,读取 SECTSIZE/ 4次。
}
使用断点调试进入bootmain

单步调试执行到call bootmain后,gdb显示如下:

1
0x7c45:  call 0x7d19

说明bootmain的起始地址是0x7d19,继续执行,后续的几行代码为:

1
2
3
4
5
6
7
8
9
10
11
=> 0x7d19:	push   %ebp          # 保存堆栈基址,ESP自动减小,栈向下生长
0x7d1a: mov %esp,%ebp # 生成栈,此时栈顶栈底相同,栈为空
0x7d1c: push %esi
0x7d1d: push %ebx
0x7d1e: push %edx
0x7d1f: push $0x0
0x7d21: push $0x1000 # 临时变量
0x7d26: push $0x10000
0x7d2b: call 0x7cda # 执行readsect
0x7d30: add $0x10,%esp
0x7d33: cmpl $0x464c457f,0x10000
在boot main中,会循环读取内核,当内核读完后,程序会去哪里?

对boot main进行反编译,得到如下结果:

点击显/隐boot/boot
1
2
3
4
5
6
7
8
9
10
11
12
13
14
15
16
17
18
19
20
21
22
23
24
25
26
27
28
29
30
31
32
33
34
35
36
37
38
39
00007d19 <bootmain>:
7d19: 55 push %ebp
7d1a: 89 e5 mov %esp,%ebp
7d1c: 56 push %esi
7d1d: 53 push %ebx
7d1e: 52 push %edx
7d1f: 6a 00 push $0x0
7d21: 68 00 10 00 00 push $0x1000
7d26: 68 00 00 01 00 push $0x10000
7d2b: e8 aa ff ff ff call 7cda <readseg>
7d30: 83 c4 10 add $0x10,%esp
7d33: 81 3d 00 00 01 00 7f cmpl $0x464c457f,0x10000
7d3a: 45 4c 46
7d3d: 75 38 jne 7d77 <bootmain+0x5e>
7d3f: a1 1c 00 01 00 mov 0x1001c,%eax
7d44: 0f b7 35 2c 00 01 00 movzwl 0x1002c,%esi
7d4b: 8d 98 00 00 01 00 lea 0x10000(%eax),%ebx
7d51: c1 e6 05 shl $0x5,%esi
7d54: 01 de add %ebx,%esi
7d56: 39 f3 cmp %esi,%ebx
7d58: 73 17 jae 7d71 <bootmain+0x58>
7d5a: 50 push %eax
7d5b: 83 c3 20 add $0x20,%ebx
7d5e: ff 73 e4 pushl -0x1c(%ebx)
7d61: ff 73 f4 pushl -0xc(%ebx)
7d64: ff 73 ec pushl -0x14(%ebx)
7d67: e8 6e ff ff ff call 7cda <readseg>
7d6c: 83 c4 10 add $0x10,%esp
7d6f: eb e5 jmp 7d56 <bootmain+0x3d>

### 下面这句就是循环执行完后的跳转
7d71: ff 15 18 00 01 00 call *0x10018 # *0x10018 = 0x10000c

7d77: ba 00 8a 00 00 mov $0x8a00,%edx
7d7c: b8 00 8a ff ff mov $0xffff8a00,%eax
7d81: 66 ef out %ax,(%dx)
7d83: b8 00 8e ff ff mov $0xffff8e00,%eax
7d88: 66 ef out %ax,(%dx)
7d8a: eb fe jmp 7d8a <bootmain+0x71>

从上面的代码中我们能看出,当读取完成后,bootmain会执行(ELFHDR->e_entry))();在汇编中这句话是调用0x10018这个内存位置上保存的函数,最后执行后代码会转到10000c上。

问题:这里我在调试过程中遇到一个问题,就是没有调试信息,使用GDB打印10000处内存提示没有”Elf”符号,说明符号表没有加载。

练习题

处理器是何时开始执行32位代码的,是什么使得处理器完成了从16位到32位代码的切换?

从下面这句代码开始执行32位代码,

1
ljmp    $PROT_MODE_CSEG, $protcseg

下面这段代码完成了从16位到32位的切换:

1
2
3
4
5
lgdt    gdtdesc
movl %cr0, %eax
orl $CR0_PE_ON, %eax
movl %eax, %cr0
ljmp $PROT_MODE_CSEG, $protcseg

boot loader 最后一句执行的语句是什么?

((void (*)(void)) (ELFHDR->e_entry))();,对应的汇编代码为:7d63: ff 15 18 00 01 00 call *0x10018

加载内核后的第一句命令是什么?

f010000c: 66 c7 05 72 04 00 00 movw $0x1234,0x472,对应的代码在entry.S

内核的第一句指令在内存什么位置?

0x0010000c

boot loader如何决定从硬盘中读取多少个sector来获得整个内核?他是从哪里得到这个信息的?

boot loader通过ELF头读取相关信息并加载所有的程序头

1
2
3
4
ph = (struct Proghdr *) ((uint8_t *) ELFHDR + ELFHDR->e_phoff);
eph = ph + ELFHDR->e_phnum;
for (; ph < eph; ph++)
readseg(ph->p_pa, ph->p_memsz, ph->p_offset);

加载内核

ELF format

在了解内核工作原理前,我们先要明白ELF格式,ELF全称为”Executable and Linkable Format”即可执行与可链接文件格式,关于这个格式的详细描述请参考ELF定义或下面的阅读材料,其中很大一部分工作是支持动态链接库。一个ELF文件的结构如下所示:

图片名称

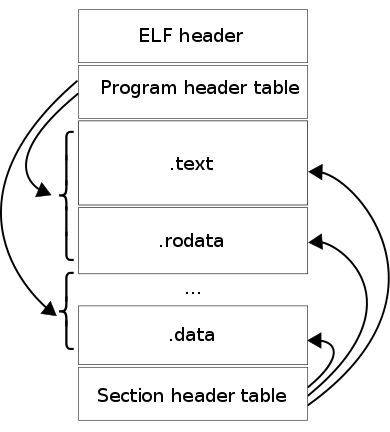
对于本课程,我们可以简单地将ELF理解为一个包含了一些载入信息的数据头和一些程序片段所组成的文件,每一个程序片段包含将要被载入到指定内存的数据和代码,Boot loader只是载入这些片段,并不对其进行任何修改。现在我们对产生的ELF格式的kernel进行分析,执行下列语句objdump -h obj/kern/kernel,得到结果如下:

1
2
3
4
5
6
7
8
9
10
11
12
13
14
15
16
17
18
19
20
21
22
23
24
25
26
27
28
$ objdump -h kernel 

kernel: 文件格式 elf32-i386

节:
Idx Name Size VMA LMA File off Algn
0 .text 00001a1d f0100000 00100000 00001000 2**4
CONTENTS, ALLOC, LOAD, READONLY, CODE
1 .rodata 000006bc f0101a20 00101a20 00002a20 2**5
CONTENTS, ALLOC, LOAD, READONLY, DATA
2 .stab 0000375d f01020dc 001020dc 000030dc 2**2
CONTENTS, ALLOC, LOAD, READONLY, DATA
3 .stabstr 00001529 f0105839 00105839 00006839 2**0
CONTENTS, ALLOC, LOAD, READONLY, DATA
4 .data 00009300 f0107000 00107000 00008000 2**12
CONTENTS, ALLOC, LOAD, DATA
5 .got 00000008 f0110300 00110300 00011300 2**2
CONTENTS, ALLOC, LOAD, DATA
6 .got.plt 0000000c f0110308 00110308 00011308 2**2
CONTENTS, ALLOC, LOAD, DATA
7 .data.rel.local 00001000 f0111000 00111000 00012000 2**12
CONTENTS, ALLOC, LOAD, DATA
8 .data.rel.ro.local 00000044 f0112000 00112000 00013000 2**2
CONTENTS, ALLOC, LOAD, DATA
9 .bss 00000661 f0112060 00112060 00013060 2**5
CONTENTS, ALLOC, LOAD, DATA
10 .comment 00000012 00000000 00000000 000136c1 2**0
CONTENTS, READONLY

可以看到不止6个段,有一些是和debug相关的,不必理会。我们这里重点关注一下.text段的VMA(link address)和LMA(load address)。load address就是某个片段实际被加载到内存当中的地址。而link address是指某个片段将要被执行时所在内存中的位置,可以简单地理解为:

  • LMA:程序加载位置
  • VMA:程序执行位置

一般来说,程序在哪里加载,就在哪里执行,所以一般情况下VMA=LMA,例如,对于我们的boot loader

1
2
3
4
5
6
7
8
objdump -h boot.out 

boot.out: 文件格式 elf32-i386

节:
Idx Name Size VMA LMA File off Algn
0 .text 0000018c 00007c00 00007c00 00000074 2**2
CONTENTS, ALLOC, LOAD, CODE

可以看到VMA = LMA。使用objdump显示kernel文件的程序头,结果如下:

1
2
3
4
5
6
7
8
9
10
11
12
13
14
$ objdump -x kernel
kernel: 文件格式 elf32-i386
kernel
体系结构:i386,标志 0x00000112:
EXEC_P, HAS_SYMS, D_PAGED
起始地址 0x0010000c

程序头:
LOAD off 0x00001000 vaddr 0xf0100000 paddr 0x00100000 align 2**12
filesz 0x00006d62 memsz 0x00006d62 flags r-x
LOAD off 0x00008000 vaddr 0xf0107000 paddr 0x00107000 align 2**12
filesz 0x0000b6c1 memsz 0x0000b6c1 flags rw-
STACK off 0x00000000 vaddr 0x00000000 paddr 0x00000000 align 2**4
filesz 0x00000000 memsz 0x00000000 flags rwx

LOAD就是要被加载到内存中的信息,其他信息还包括虚拟地址(“vaddr”),物理地址(“paddr”),加载空间的大小(“filesz”和”memsz”)。回到我们上面的boot/main.cph->p_pa域包含了每个段的目标物理地址。BIOS将boot的片段加载到0x7c00所在的内存位置,并从这个位置开始执行。我们可以在boot/Makefrag文件下修改链接的地址,打开Makefrag文件,其内容如下:

1
2
3
4
5
6
7
8
...
$(OBJDIR)/boot/boot: $(BOOT_OBJS)
@echo + ld boot/boot
$(V)$(LD) $(LDFLAGS) -N -e start -Ttext 0x7C00 -o $@.out $^
$(V)$(OBJDUMP) -S $@.out >$@.asm
$(V)$(OBJCOPY) -S -O binary -j .text $@.out $@
$(V)perl boot/sign.pl $(OBJDIR)/boot/boot
...

我们可以看到,链接地址为-Ttext 0x7c00,这个地址是BIOS指定的,我们可以修改这个地址,从而跳过一些特定的指令,来观察boot loader 的表现。

通过修改boot/Makefrag下链接地址,我们可以修改boot loader加载与运行地址,我们将地址前移,观察跳过一些语句后boot loader 会发生什么。将-Ttext 0x7C00改为-Ttext 0x7BFC,重新make,没有问题,objdump -h boot.out,发现该程序的信息如下:

1
2
3
4
节:
Idx Name Size VMA LMA File off Algn
0 .text 0000018c 00007bfc 00007bfc 00000074 2**2
CONTENTS, ALLOC, LOAD, CODE

可以看到VMA和LMA此时都变成了00007bfc。

直观表现

我总结了一下修改link address后boot loader的直观表现,其中有一些比较奇怪,这里总结一下:

  • 对于反汇编后得到的文件/obj/boot/boot.asm,起始地址确实是变了,变为
1
2
3
4
5
6
7
8
9
10
11
12
13
14
00007bfc <start>:                                                               
.set CR0_PE_ON, 0x1 # protected mode enable flag

.globl start
start:
.code16 # Assemble for 16-bit mode
cli # Disable interrupts
7bfc: fa cli
7bfd: fc cld

...

7c00: 8e d8 mov %eax,%ds
...

这一点是符合预期的。

  • 进行gdb调试,设置断点位置为0x7c00,原本以为0x7c00所在位置的语句会从原先的cli变为mov,但是奇怪的是并没有,x/10得到的结果如下:
1
2
3
4
5
6
7
8
9
10
11
12
Breakpoint 1, 0x00007c00 in ?? ()
(gdb) x/10 0x7c00
=> 0x7c00: cli
0x7c01: cld
0x7c02: xor %ax,%ax
0x7c04: mov %ax,%ds
0x7c06: mov %ax,%es
0x7c08: mov %ax,%ss
0x7c0a: in $0x64,%al
0x7c0c: test $0x2,%al
0x7c0e: jne 0x7c0a
0x7c10: mov $0xd1,%al

可以看到,0x7c00依然是cli,这一点令我非常疑惑。目前还没有比较好的答案(先跳过不管了),经过我实验,将地址前移或者后移后,均无法正确加载bootloader程序。每次都会在ljmp $0x8,$0x7c32这条语句处发生跳转,重新回到BIOS第一条语句。

在ELF头中,除了section的信息,还有一个比较重要的是e_entry信息,表示程序的入口地址,我们可以使用objdump -f查看

1
2
3
4
5
6
objdump -f obj/kern/kernel

obj/kern/kernel: 文件格式 elf32-i386
体系结构:i386,标志 0x00000112:
EXEC_P, HAS_SYMS, D_PAGED
起始地址 0x0010000c

所以我们现在基本摸清了ELF loader的套路,将kernel中的每个section导入内存中,然后跳转至程序入口。

练习6:观察0x00100000内存

分别在BIOS进入boot loader和boot loader进入kernel的位置设置断点,然后运行至断点处,此时使用x/8x打印0x00100000开始的8个word的内存并观察,说明两者有何不同

在BIOS进入boot loader处,0x00100000内存中内容为:

1
2
3
4
5
6
[   0:7c01] => 0x7c01:	cld    
0x00007c01 in ?? ()

(gdb) x/8 0x00100000
0x100000: 0x00000000 0x00000000 0x00000000 0x00000000
0x100010: 0x00000000 0x00000000 0x00000000 0x00000000

空的,然后在boot loader进入kernel的位置(0x0010000c)设置断点,再次访问0x00100000,其中的内容变为:

1
2
3
(gdb) x/8x 0x00100000
0x100000: 0x1badb002 0x00000000 0xe4524ffe 0x7205c766
0x100010: 0x34000004 0x1000b812 0x220f0011 0xc0200fd8

说明内核被加载到了0x00100000这个位置,或者说有一部分在这个位置。实际上这里存储了内核的代码。

内核

虚拟内存初步建立

了解了内核引导程序的原理,现在我们正式开始接触内核。在boot loader中,link address和load address是一致的,但是在内核程序中则不是这样,关于内核的链接地址详见/kern/kernel.ld

1
2
3
4
5
6
7
8
9
10
11
SECTIONS                                                                        
{
/* Link the kernel at this address: "." means the current address */
. = 0xF0100000;

/* AT(...) gives the load address of this section, which tells
the boot loader where to load the kernel in physical memory */
.text : AT(0x100000) {
*(.text .stub .text.* .gnu.linkonce.t.*)
}
...

在这个链接文件中,一开头就明确指出,LMA为0x100000,而VMA即链接地址为0xF0100000。说明内核在0x100000处加载,在0xF0100000处执行。但一些计算机可能根本没有0xF0100000这么大位置的内存,所以这里引入了虚拟内存的概念。将虚拟内存0xf0100000映射至0x00100000,所以内核存储在0x00100000的物理地址,然后在0xf0100000的虚拟地址处执行。低位的虚拟内存就留给用户使用。内存映射表详见kern/entrypgdir.c,这里只映射了4MB的地址。注意,这里实际就是将内核的一部分进行了虚拟化,建立了虚拟地址到物理地址的映射。当完成实验2和实验3后,再回顾这里会有更深的体会。

我们现在看一下entrypgdir.c中的内容:

1
2
3
4
5
6
7
8
9
10
11
12
13
14
15
16
17
18
19
20
21
22
23
24
25
26
27
28
29
30
31
32
33
34
35
36
37
38
39
#include <inc/mmu.h>
#include <inc/memlayout.h>

pte_t entry_pgtable[NPTENTRIES];

// The entry.S page directory maps the first 4MB of physical memory
// starting at virtual address KERNBASE (that is, it maps virtual
// addresses [KERNBASE, KERNBASE+4MB) to physical addresses [0, 4MB)).
// We choose 4MB because that's how much we can map with one page
// table and it's enough to get us through early boot. We also map
// virtual addresses [0, 4MB) to physical addresses [0, 4MB); this
// region is critical for a few instructions in entry.S and then we
// never use it again.
//
// Page directories (and page tables), must start on a page boundary,
// hence the "__aligned__" attribute. Also, because of restrictions
// related to linking and static initializers, we use "x + PTE_P"
// here, rather than the more standard "x | PTE_P". Everywhere else
// you should use "|" to combine flags.
__attribute__((__aligned__(PGSIZE)))
pde_t entry_pgdir[NPDENTRIES] = {
// Map VA's [0, 4MB) to PA's [0, 4MB)
[0]
= ((uintptr_t)entry_pgtable - KERNBASE) + PTE_P,
// Map VA's [KERNBASE, KERNBASE+4MB) to PA's [0, 4MB)
[KERNBASE>>PDXSHIFT]
= ((uintptr_t)entry_pgtable - KERNBASE) + PTE_P + PTE_W
};

// Entry 0 of the page table maps to physical page 0, entry 1 to
// physical page 1, etc.
__attribute__((__aligned__(PGSIZE)))
pte_t entry_pgtable[NPTENTRIES] = {
0x000000 | PTE_P | PTE_W,
0x001000 | PTE_P | PTE_W,
0x002000 | PTE_P | PTE_W,
0x003000 | PTE_P | PTE_W,
0x004000 | PTE_P | PTE_W,
0x005000 | PTE_P | PTE_W,

这个文件将4MB大小的物理空间[0,4MB]映射至[KERNBASE, KERNBASE+4MB],启动阶段完全够用了,4MB就是一个页表能容纳的容量。后续的虚拟空间到物理空间的映射我们会在内核代码中完成。这部分内存是内核可写的。映射完成后,页目录的第0项与第KERNBASE >> PDXSHIFT项均指向页表entry_pgtable。从这里我们可以看到,页目录每一项指向的页表为4MB,而页目录共1024项,总可映射内存为4GB

练习7:实模式和保护模式下的内存

进入内核然后停留在mov %eax, %cr0这条语句处,验证此时0x001000000xf0100000两个内存位置处的内存,然后si执行mov %eax, %cr0,再次验证这两个位置的内存,有什么现象?

mov %eax, %cr0的作用是开启地址的映射,将高位地址映射至低位地址上,所以没有执行这句语句前,0xf0100000处的内存是不存在的,故显示

1
0xf0100000 <_start-268435468>:	Cannot access memory at address 0xf0100000

0x00100000处则存储了内核的代码。当执行mov %eax, %cr0后,开启了地址映射,会发现0xf0100000被映射至了0x00100000处,两者存放的内容相同。

1
2
3
4
5
6
7
8
9
10
11
(gdb) x/10 0xf0100000
0xf0100000 <_start-268435468>: add 0x1bad(%eax),%dh
0xf0100006 <_start-268435462>: add %al,(%eax)
0xf0100008 <_start-268435460>: decb 0x52(%edi)
0xf010000b <_start-268435457>: in $0x66,%al

gdb) x/10 0x00100000
0x100000: add 0x1bad(%eax),%dh
0x100006: add %al,(%eax)
0x100008: decb 0x52(%edi)
0x10000b: in $0x66,%al

控制台格式化输出

阅读kern/printf.clib/printfmt.c以及kern/console.c三个文件,弄清三者之间的关系。我们先针对控制台程序进行整理,对代码的详细分析参考下面的链接

而printfmt是带有格式的输出,printf是printfmt的封装,底层调用的是console中的cputchar,最后留给上层的系统调用为cprintf,所以三个文件的关系如下:

graph BT
    node1["console"]
    node2["printfmt"]
    node3["printf"]

    node1-->node2
    node2-->node3

这也解释了为何printfmt被放在了lib中,因为它是作为库被调用的,而不是直接给用户的系统调用。其中输出八进制的代码被省略了,补充完成后如下:

1
2
3
4
case 'o':
num = getuint(&ap, lflag);
base = 10;
goto number;

然后在monitor.c里加一句:

1
cprintf("%u decimal is %o octal!\n", num,num);       // num is 6828

然后执行make grade即可,显示printf: OK,说明代码没有问题。

1
2
running JOS: (0.7s) 
printf: OK

回答下面的问题:

解释printf.c和console.c之间的关系,console.c开放了哪些函数,这些函数是如何被printf.c使用的?

观察console.c,可以看到下列函数之前没有加static,即为开放函数:

1
2
3
4
5
6
7
void  serial_intr(void)  // 串口中断
void kbd_intr(void) // 键盘中断
int cons_getc(void) // 控制台读取字符
void cons_init(void) // 控制台初始化
void cputchar(int c) // 写入字符
int getchar(void) // 获取一个字节
int iscons(int fdnum) //

而在pringf中,使用到的函数为cputchar,其函数及内部调用的定义如下:

1
2
3
4
5
6
7
8
9
10
11
12
13
14
15
16
17
18
19
20
21
22
23
24
25
26
27
void
cputchar(int c)
{
cons_putc(c); // 说明外部文件可以通过调用全局函数,而全局函数再调用局部函数的方式调用局部函数
}

// output a character to the console
static void
cons_putc(int c)
{
serial_putc(c);
lpt_putc(c);
cga_putc(c);
}

static void
serial_putc(int c) // 从串口输出
{
int i;

for (i = 0;
!(inb(COM1 + COM_LSR) & COM_LSR_TXRDY) && i < 12800;
i++)
delay();

outb(COM1 + COM_TX, c);
}

解释下面的console.c中的代码片段

1
2
3
4
5
6
7
8
9
10
11
12
// crt_pos uint16_t 光标位置
// #define CRT_ROWS 25
// #define CRT_COLS 80
// #define CRT_SIZE (CRT_ROWS * CRT_COLS)

if (crt_pos >= CRT_SIZE) { //超出屏幕范围
int i;
memmove(crt_buf, crt_buf + CRT_COLS, (CRT_SIZE - CRT_COLS) * sizeof(uint16_t)); // 将buf中的内容进行移动,从而产生滚动屏幕的效果
for (i = CRT_SIZE - CRT_COLS; i < CRT_SIZE; i++) //将最后一行用空格进行填充
crt_buf[i] = 0x0700 | ' ';
crt_pos -= CRT_COLS; // 将光标退回至行首
}

这段代码出现在cga_putc中,我们先要明确其中变量、宏定义以及魔数的作用。详细注释见上方代码,总之其功能就是在CGA设备写满了内容后,将内容上滚,并产生新行,在qemu仿真中,终端的窗口大小就是25*80。

单步调试下面的代码:

1
2
3
> int x = 1, y = 3, z = 4;
> cprintf("x %d, y %x, z %d\n", x, y, z);
>

>

  • 在调用cprintf()的过程中,fmt指向哪里?ap指向哪里?

  • 列出每一次对cons_putc,va_arg以及vcprintf的调用,对于cons_putc,列出所有的参数;对于va_arg,列出调用前后ap指针指向的内容,对于vcprintf,列出两个参数的值。

练习8:栈初始化

阅读内核代码,指出栈是在哪里初始化的?位于哪个内存?如何预留栈空间?栈指针指向哪里?

entry.S中,栈初始化语句如下:

1
2
3
4
5
movl $(stack + KSTACKSIZE), %esp

...

.comm stack, KSTACKSIZE # 4096

栈大小为KSTACKSIZE,位于data段中,预留的方式是通过.comm命令对栈空间进行分配,esp指针指向 stack + KSTACKSIZE处。

练习9:test_backtrace函数

找到test_backtrace函数,然后设置断点,观察每次调用这个函数时会发生什么

使用nm命令在kernel中找到test_backtrace,其位置为0xf0100040,在此处设置一个断点,然后执行至此处,可以发现这个函数是一个递归函数,源码如下:

1
2
3
4
5
6
7
8
9
void 
test_backtrace(int x){
cprintf("entering test_backtrace %d\n", x);
if(x > 0)
test_backtrace(x-1);
else
mon_backtrace(0,0,0);
printf("leaving test_backtrace %d\n", x);
}

每一次递归调用,在函数栈上增加一层,例如调用test_backtrace(5)并使用gdb调试得到结果如下:

1
2
3
4
5
(gdb) bt
#0 test_backtrace (x=4) at kern/init.c:13
#1 0xf0100076 in test_backtrace (x=5) at kern/init.c:16
#2 0xf01000f4 in i386_init () at kern/init.c:39
#3 0xf010003e in relocated () at kern/entry.S:80

每次调用后会有以下几个push语句:

1
2
3
4
push %ebp  # 保存栈底
push %esi # 源操作数偏移量(是printf中内容的偏移量吗)
push %ebx # 保存ebx寄存器,eax、ecx和edx由硬件进行保存
push %eip # 保存返回指令

为了更细致地分析函数调用栈的行为,我们进一步使用gdb进行分析,首先我们分析栈指针%ebp的情况:

栈指针%ebp的情况

在我们进入到test_backtrace函数前,即在enter.S中,我们能够看到这样一行代码:

1
2
3
4
5
6
7
# Clear the frame pointer register (EBP)                                                                     # so that once we get into debugging C code,                                                                 # stack backtraces will be terminated properly.                                                             
movl $0x0,%ebp # nuke frame pointer

# Set the stack pointer
movl $(bootstacktop), %esp # bootstacktop为f0100000

call i386_init

将栈基底设置为0x0,然后将栈顶指针设置为bootstacktop,然后下面一句开始调用i386_init函数,将eip压栈,则f010effc保存着返回地址eip的值,为0xf010003e,进入函数后,首先要进行栈分配,保存前一栈帧的栈底,即push %ebp,故0xf010eff8保存的内容为0x00000000,即最开始栈的栈底,然后执行mov %esp, %ebp,所以从这里我们得到一个关键信息:ebp保存着前一个调用栈的栈底ebp’,用数学语言描述如下:

即第$n$个ebp的值为第$n-1$个栈的基地址,而初始的$\%ebp_0$即为第一个站的栈底。所以我们的backtrace结束条件可以写为

1
if(get_ebp() == 0x0)
%eip的情况

现在我们来分析另一个重要的寄存器eip的情况,因为函数返回后要返回到恰当的位置继续执行,所以eip的值也要被妥善保存。由于我们在使用call命令时先将eip进行了push,所以实际上eip先于ebp被保存,在栈中的保存位置如下:

1
2
0xf010effc:  0xf010003e (value of ret eip)    //栈是向下增长的
0xf010eff8: 0x00000000 (value of ret ebp)
输入参数的情况

在调用函数之前,还有一个非常关键的步骤就是给函数提供输入参数,而在实际调试过程中,我们可以发现函数调用时顺序如下:

  1. push参数,从后往前(如果只有一个参数,也可能直接mov $value, %esp,这个看具体的实现过程)

  2. 再调用call,将返回位置所在的eip压栈

  3. 调用call后,第一条语句就是push %ebp,将前一个函数的栈底进行保存

至此,我们可以画出一个函数void func(arg1, arg2, ... , argn)调用过程的栈模型如下:

图片名称

在实际调试过程中,backtrace的模型确实如此。

练习10:实施一个mon_backtrace函数

在了解了上面的函数调用过程后,我们来实施一个backtrace函数,这个函数能够根据函数的调用深度,打印调用栈中的一些关键信息,包括:当前函数的栈底、当前函数的返回地址以及当前函数的参数,格式如下:

1
2
3
4
Stack backtrace:
ebp f0109e58 eip f0100a62 args 00000001 f0109e80 f0109e98 f0100ed2 00000031
ebp f0109ed8 eip f01000d6 args 00000000 00000000 f0100058 f0109f28 00000061
...

这个函数位于kern/monitor.c中,写完后记得将其和命令挂钩,这样用户就能通过这个命令查看函数调用栈的情况。

1
2
3
4
5
6
7
8
9
10
11
12
13
int __attribute__((optimize("O0")))
mon_backtrace(int argc, char **argv, struct Trapframe *tf)
{
cprintf("Stack backtrace:\n");

// Your code here.
unsigned int *ebp = (unsigned int *)read_ebp(); //get the frame base of backtrace
while(*ebp != 0x0){
cprintf("ebp %x eip %x args %08x %08x %08x %08x %08x\n", *ebp, ebp[1], ebp[2], ebp[3], ebp[4], ebp[5], ebp[6]);
ebp =(unsigned int *) (*ebp);
}
return 0;
}

这个函数需要注意以下几点:

  • 因为保存的都是32位地址,所以我们采用了unsigned int*类型定义了一个ebp指针
  • read_ebp()得到的是ebp寄存器中的内容,即被调用函数的栈基址,我们需要对其进行解引用操作,*ebp为调用者的栈基址
  • 使用ebp[1]表示*(ebp+1),注意地址的加法和数的加法是不一样的
  • ebp[2]-ebp[6]分别表示五个变量
  • _attribute_((optimize(“O0”)))表示关闭优化,因为编译器是有可能先执行read_ebp()函数,再调用mon_backtrace,但是在我这里不可能,因为在read_ebp之前调用了cprintf,所以不会出错,当然保险起见还是加上禁止优化(虽然这么写可能不太规范,还是应该在函数一开始就定义变量)

这个函数目前还是比较简陋的,它只能打印出内存中的内容,不能打印返回函数所在的文件、行数;同时打印的参数个数也是固定的,为5个,因此我们需要对其进行一些修改,使它能够打印更加丰富的信息。

练习11:改进的mon_backtrace

问题描述

我们现在要将mon_backtrace进行改进,使其可以输出更多的信息,包括函数所在文件、行数等。

探究符号表及其载入

这里提供了一个debuginfo_eip(),可以根据eip找到对应的符号表,eip的debuginfo定义如下:

1
2
3
4
5
6
7
8
9
10
11
12
13
// Debug information about a particular instruction pointer                     
struct Eipdebuginfo {
const char *eip_file; // Source code filename for EIP
int eip_line; // Source code linenumber for EIP
const char *eip_fn_name; // Name of function containing EIP
// - Note: not null terminated!
int eip_fn_namelen; // Length of function name
uintptr_t eip_fn_addr; // Address of start of function
int eip_fn_narg; // Number of function arguments
};

int
debuginfo_eip(uintptr_t addr, struct Eipdebuginfo *info)

debuginfo_eip比较长,总之就是把给定addr处的指令进行解析,然后填充到info,成功返回0,否则返回负数。阅读debuginfo_eip后,回答下面的问题:

在debuginfoeip函数中用到了\_STAB__*(_STAB_BEGIN\_等,表示符号表保存的位置等信息),这个东西是哪里来的?

为了解决这个问题,我们需要做如下几件事:

  • 阅读kern/kernel.ld,找到_STAB_*(说明符号表是在链接阶段产生的),这里需要对link script的基本写法有一些了解。

kern/kernel.ld中:

1
2
3
4
5
.stab : {
PROVIDE(__STAB_BEGIN__=.)
*(.stab);
PROVIDE(__STAB_END__=.)
}
  • 运行objdump -h obj/kern/kernel,结果如下
1
2
3
4
5
6
Sections:
...
Idx Name Size VMA LMA File off Algn
2 .stab 00003f19 f010239c 0010239c 0000339c 2**2
CONTENTS, ALLOC, LOAD, READONLY, DATA
...

从中可以看到.stab的分配情况。

  • 运行objdump -G obj/kern/kernel,结果如下
1
2
3
4
5
6
7
8
9
10
11
12
13
14
15
16
17
18
19
20
21
22
23
24
25
26
27
28
29
30
31
32
33
34
35
36
obj/kern/kernel:     file format elf32-i386

Contents of .stab section:

Symnum n_type n_othr n_desc n_value n_strx String
... # 以下为init.c中的符号表所在位置
23 SO 0 2 f0100040 268 kern/init.c # SO 为源文件
24 OPT 0 0 00000000 49 gcc2_compiled.
25 FUN 0 0 f0100040 280 i386_init:F(0,1)=(0,1)
26 LSYM 0 0 00000000 303 void:t(0,1)
27 SLINE 0 15 00000000 0
28 SLINE 0 21 00000012 0
29 SLINE 0 21 00000020 0
30 SLINE 0 25 00000029 0
31 SLINE 0 30 0000002e 0
32 SLINE 0 34 00000036 0
33 FUN 0 0 f0100085 315 _panic:F(0,1)
34 PSYM 0 0 00000008 329 file:p(0,2)=*(0,3)=r(0,3);0;127;
35 PSYM 0 0 0000000c 362 line:p(0,4)=r(0,4);-2147483648;2147483647;
36 PSYM 0 0 00000010 405 fmt:p(0,2)
37 LSYM 0 0 00000000 416 char:t(0,3)
38 LSYM 0 0 00000000 428 int:t(0,4)
39 SLINE 0 50 00000000 0
40 SLINE 0 53 00000010 0
41 SLINE 0 69 00000019 0
42 SLINE 0 55 00000028 0
43 SLINE 0 58 00000031 0
44 SLINE 0 60 00000033 0
45 SLINE 0 61 00000036 0
46 SLINE 0 62 0000004b 0
47 SLINE 0 63 00000057 0
48 FUN 0 0 f01000ef 439 _warn:F(0,1)
49 PSYM 0 0 00000008 452 file:p(0,2)
50 PSYM 0 0 0000000c 464 line:p(0,4)
51 PSYM 0 0 00000010 405 fmt:p(0,2)
...

结果很长,总之这里记录的是stab段中的内容,给出了符号和对应的地址。

  • 运行下列命令
1
$ gcc -pipe -nostdinc -O2 -fno-builtin -I. -MD -Wall -Wno-format -DJOS_KERNEL -gstabs -c -S kern/init.c

然后查看init.S,可以看到一段非常冗长的代码:

点击显/隐代码段
1
2
3
4
5
6
7
8
9
10
11
12
13
14
15
16
17
18
19
20
21
22
23
24
25
26
27
28
29
30
31
32
33
34
35
36
37
38
39
40
41
42
43
44
45
46
    .file	"init.c"
.stabs "kern/init.c",100,0,2,.Ltext0 # .stabs string, type, other, desc, value
.text
.Ltext0:
.stabs "gcc2_compiled.",60,0,0,0
.section .rodata.str1.1,"aMS",@progbits,1
.LC0:
.string "entering test_backtrace %d\n"
.LC1:
.string "leaving test_backtrace %d\n"
.text
.p2align 4
.stabs "test_backtrace:F(0,1)=(0,1)",36,0,0,test_backtrace
.stabs "void:t(0,1)",128,0,0,0
.stabs "x:P(0,2)=r(0,2);-2147483648;2147483647;",64,0,0,6
.stabs "int:t(0,2)",128,0,0,0
.globl test_backtrace
.type test_backtrace, @function
test_backtrace:
.stabn 68,0,13,.LM0-.LFBB1
.LM0:
.LFBB1:
.LFB0:
.cfi_startproc
pushq %r15
.cfi_def_cfa_offset 16
.cfi_offset 15, -16
.stabn 68,0,14,.LM1-.LFBB1
.LM1:
movl %edi, %esi
xorl %eax, %eax
.stabn 68,0,13,.LM2-.LFBB1
.LM2:
pushq %r14
.cfi_def_cfa_offset 24
.cfi_offset 14, -24
pushq %r13
.cfi_def_cfa_offset 32
.cfi_offset 13, -32
pushq %r12
.cfi_def_cfa_offset 40
.cfi_offset 12, -40
pushq %rbp
.cfi_def_cfa_offset 48
.cfi_offset 6, -48
.stabn 68,0,13,.LM3-.LFBB1

结合这段代码中的.stab*段以及上面的objdump -G obj/kern/kernel的输出结果,我们可以看到init.s中的.stab段已经被分配了具体的内存,同理其他的段和指令也会被分配相应的内存。也就是说我们的符号表被载入到了内存当中。

  • 看看bootloader工作时会不会将符号表载入内存中

这里没搞明白,还有以下几个问题:

  1. 符号表是何时载入的?
  2. 载入到了哪里

还需要对符号表进行更深入的了解。总之这里我们知道,kernel加载过程中符号表也被载入,根据符号表,我们能够解析出eip保存的指令所在文件、行号、参数等相关信息。现在我们来对mon_backtrace进行改进。

改进mon_backtrace

首先,我们需要改进kern/kdebug.c中的debuginfo_eip函数,添加行号搜索功能,根据提示添加如下:

1
2
3
4
5
6
7
8
9
10
11
12
13
14
15
// Search within [lline, rline] for the line number stab.
// If found, set info->eip_line to the right line number.
// If not found, return -1.
//
// Hint:
// There's a particular stabs type used for line numbers.
// Look at the STABS documentation and <inc/stab.h> to find
// which one.
// Your code here.
stab_binsearch(stabs, &lline, &rline, N_SLINE, addr);
if (lline <= rline){
info->eip_line = rline;
} else {
return -1;
}

然后修改mon_backtrace,调用debuginfo_eip并按照格式输出相关信息。修改后的mon_backtrace如下:

1
2
3
4
5
6
7
8
9
10
11
12
13
14
15
mon_backtrace(int argc, char **argv, struct Trapframe *tf)                      
{
cprintf("Stack backtrace:\n");

// Your code here.
unsigned int *ebp = (unsigned int *)read_ebp(); //get the frame base of backtrace
while(*ebp != 0x0){
cprintf("ebp %x eip %x args %08x %08x %08x %08x %08x\n", *ebp, ebp[1], ebp[2], ebp[3], ebp[4], ebp[5], ebp[6]);
debuginfo_eip(ebp[1], &info);
cprintf("%s:%d: %.*s+%u\n", info.eip_file, info.eip_line, info.eip_fn_namelen, info.eip_fn_name, ebp[1]-info.eip_fn_addr);
//由于info.eip_fn_name并不是以0结尾,所以我们需要输出指定长度的函数名info.eip_fn_namelen
ebp =(unsigned int *) (*ebp);
}
return 0;
}

至此,Lab1的内容就全部完成了。

阅读材料

Selection of Operating System Papers

Available on the 6.828 schedule.

UNIX

x86 Emulation

  • QEMU

    - A fast and popular x86 platform and CPU emulator.

  • Bochs

    - A more mature, but quirkier and much slower x86 emulator. Bochs is generally a more faithful emulator of real hardware than QEMU.

x86 Assembly Language

PC Hardware Programming

参考文献

0%